This issue of the Views delves further into the relationship of shoppers to the store. To do this it helps to put this into the context of science and shopping, and how to think about the 5 major entities of shopping. Without a decent view of the whole beast, it is very easy to hold inadequate views of even those parts that we might be expert on. So we begin with an overview of the five entities at retail - and will continue our focus on self-service retail, although for service-mediated retailing the entities are the same, with some obvious differences in function.
The Five Entities
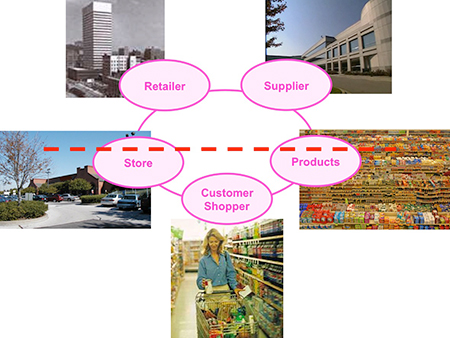
The interrelations of the five entities, diagrammed here, is the key to understanding retail and shopping. It is particularly striking to contrast those relationships above the red line with those below the red line. The goal of this Views is to survey just one of the five entities: the store.
First, a brief excursion into the fundamentals of science, to ground our approach. The foundation of science is observation and measurement. As individuals, we are all subjective, but the world around us is objective, that is, us subjects can share in observing the objects about us. What any one can observe, all can observe. This is the foundation of scientific knowledge. For us to share our knowledge, as well as to expedite our own thinking, we must name objects, and organize things into categories. So we begin with naming five entities, and will proceed with the same approach in naming the component parts of the store.
Next, we are mindful of Lord Kelvin's admonition that: "If you cannot express your knowledge in numbers, it is of a meager and unsatisfactory sort!" In addition to counting the entities, we will count both the money and shoppers time involved in global retailing, as well as in the various areas of individual stores. For money it is $14 trillion annually; and for time it is something like a quadrillion seconds.
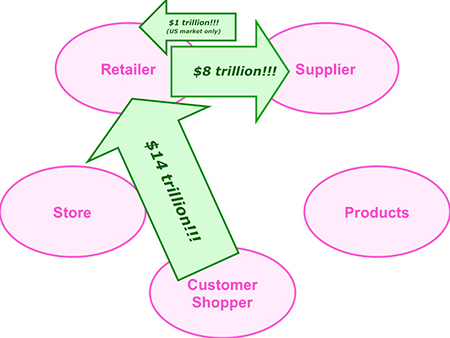
Of the $14 trillion shoppers spend over the year, the retailer sends $8 trillion on to their suppliers, spending the rest on building and operating stores. Notice that in the U.S. market alone, the suppliers return $1 trillion back to the retailers in the form of promotional fees, trade allowances, etc., which, given the very narrow net margins on sales, becomes the dominant source of profits for very many retailers!
The Store
Size. Probably the single most significant store factor is the size of the store. If we look at a range of stores, from very small to huge, it is obvious that they function differently. For tiny stores we sometimes comment that, "how shoppers shop in a closet is not very interesting!" From a scientific point of view, that really isn't true, it's just that the range and arrangement of stimuli in a small store is much less complex than in larger stores. However, we recognize that in taking a store from the size of a small convenience store, to a large mall center, there are transitions that occur in the shopping experience that are of a quantum leap nature.
For example, from the convenience store size up through most of the supermarket range, shoppers relate to the store as a single unit, and think of themselves as "shopping the store," not "shopping the produce, meat and dairy departments," even if in fact that is all of the store that they visit. Up to a size somewhere between 50,000 to 100,000 square feet, the store is considered a unitary whole. Above that size, the store begins to fragment into a compound store, with two or more distinct stores inside it. Shoppers then perceive these as conjoined stores, not a single store they visit. Of course the compound nature of a shopping mall is made explicit by architecturally separating the stores. But even if there are no walls separating the "stores" in the compound store, they will nonetheless take on more of a distinctive role for the shopper, than do departments in smaller stores. You can find something about the general relation between penetration of a store by shoppers and the size of the store in If you build it, they will NOT come!
Aisleness. This refers to the degree to which the store is subdivided into aisles, rather than left in a more open, bazaar-like structure, with lower "table" displays and less restriction on movement of the shoppers. There is more discussion of the impact of restricting shoppers, in The Aisleness of Stores.
The next three factors we will consider are what we refer to as the shopping domains. These are geography, display and product. These three interact in surprising ways inside the store, to deliver sales. Think of what follows as an introduction to the geographic domain, and how it interacts with types of displays as well as with product categories in consuming shoppers' time and money to deliver sales.
Sectors (Geographic Domains.) Shopper behavior in stores is amazingly dependent on just where shoppers are in the store, geographically. In order to investigate and demonstrate this crucial fact about shopping, it is first necessary to create a structure and language for store geography. This geography paradigm is especially essential for any type of large scale, multi-store study that compares shopper behavior across stores.
The simplest way to express geography in the store is to describe it as five general areas: front, back, left, right and center. This is the foundation of a sector scheme for classifying store geography. The most practical level of sectors is usually twelve (but could be 48, for greater resolution of detail, or any other number, suitable for the specific task at hand):
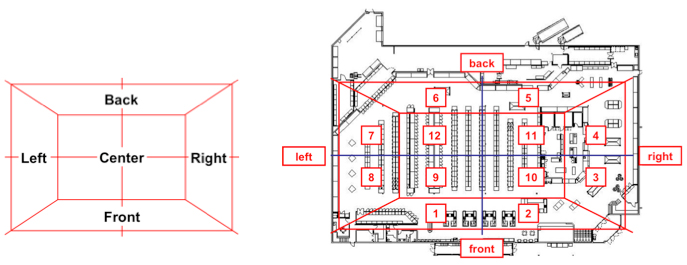
On the left here you see the basic plan referred to as "Quadrants Plus" since it relies on the idea of dividing the store into quadrants, but functionally uses a quincunx, which is a five component figure, rather than the four of the quadrant. This allows us to double the area of the "fifth quadrant" the center of the store, so when we further subdivide the store, we split the left/right/front/back into two sectors for each, and the center into four sectors. This creates a standardized shape that approximates the selling/service function of a lot of stores. We can use this to standardize metrics across the store, relative to these twelve geographic sectors, and retain some semblance of the relationship to the way people think about the layout of the store. It is important to understand this as the scientific way to look at stores, beginning with defining/naming twelve sector-buckets, we are then prepared to count the things in those buckets (shoppers and their time, e.g.,) as the means of understanding them, and distinguishing behavior bucket by bucket.
On the right side above, you see this sector model overlaid on an existing floor plan. You may notice the stretching of the golden rectangle shape on the left in order to fit more closely to the dimensions of the actual store. When this is done mathematically, the store's floor plan is instead "poured" into the sector structure in such a way that every sector contains an equal amount of the shoppers' available traffic space, and the space of each conformed sector maintains its original relation to the adjacent sectors - boundaries, left/right, etc. The store conformed to the idealized sector structure is referred to as the "Picasso store," since just as the artist conformed his images to some personal perception, we can conform every store in the world into a standardized internal geography, suitable for counting behaviors by geography in individual stores, and for mathematical inter-comparison of any number of stores. (For more details, see In-store media rating system and method, US Patent 8,041,590.)
Just for starters, there are two valuable applications for geographically studying stores. The first of these is to cluster stores according to how shoppers use them. This is pushing far beyond standard retail practice of measuring store performance by the flow of merchandise through it, and the poorly discriminating metric of sales per square foot. Rather, we can cluster stores by the way shoppers distribute their time across these stores, allowing a more apples to apples comparison - within a cluster - or explicitly comparing apples to oranges, by comparing stores from different clusters.

In this diagram we see the distribution of shoppers in the four basic traffic types of supermarkets across America. The color codes indicate where shoppers spend their time. The range is from where shoppers spend a lot of time: red; with lesser amounts, progressively through orange, yellow, green, lighter blue; to where shoppers spend very little time, dark blue. This is of significance because where shoppers spend their time is where there is the greatest opportunity to sell to them - every second is another opportunity to sell.
Here we are looking at a few dozen supermarkets scattered across the United States. Each of these clusters has distinctive performance characteristics, driven in a major way by the shared architectural design of the stores. For example, we already know that left entry stores, as a class, perform more poorly than right entry stores. The purpose of clustering stores is to learn the impact of various design features on the performance of those stores, aka how well the stores meet the needs of the shoppers in them. Remember, success at retail is not just about products and shoppers, but the details of how those interact to deliver sales.
Now suppose this segmentation into clusters represented a single chain of hundreds or even thousands of stores. These clusters would then mean, that from the shoppers' usage points of view, there are a few basic types of stores in that particular chain, and those types have distinctive relationships to their shoppers. Rather than merchandise to the shoppers in those distinctive environments relying on "received wisdom," one can match more closely the merchandising to the store cluster. The advisability of this will become more apparent when we sharpen the focus on the four sectors in the center-of-store in a single cluster of congruent stores.
So the very fact that you can cluster stores by internal shopper traffic maps (density and flow, e.g.,) means that geographic structure has a far greater impact on the performance of the store than might have been imagined. Just because you, as management, see that the interior of two stores have the same general appearance and all the same displays and merchandise, does not mean that the two stores will perform approximately the same, even if the composition of their customer base is similar. So we will now look further into how a single cluster actually performs in one major section of the store: the center-of-store aisles.
Atlas: The In-Store Behavior Map. The store segmentation we discussed in clustering large groups of stores (above,) was based on the patterns of total seconds distributed across the entire store. Now we take a deep-dive into the mechanics of how those seconds are converted to sales (or not,) in one section (the center-of-store,) for a group of stores - what we refer to as congruent stores. Congruent stores are similar across major design/internal geographic considerations. In this case, all the selected stores are right entry, similar sized, with no transverse aisles in the center-of-store area, etc. What these stores did have is a wide variety of specific category locations. That is, across the stores, peanut butter would be found in a variety of geographic locations.
For analysis purposes, each aisle was divided into six sections, front-to-back, and aisles themselves were grouped into six groups, from left-to-right. This effectively comminuted the four center-of-store Picasso sectors into three-by-three grids, giving 36 center-of-store locations, for study of their relative performances. The results are diagrammed below in terms of the double conversion performance of the 36 grid points. Again we are using the scientific approach of first distinguishing and naming/identifying parts of the total (36 distinct areas,) and then we will count behaviors within those areas, and finally compute the relationships among those areas. (See The Power of Atlas: Why In-Store Shopping Behavior Matters; also, "The Three Shopping Currencies," in the second edition of Shopper Marketing edited by Markus Stahlberg and Ville Maila, Kogan Page publisher, publication pending.)
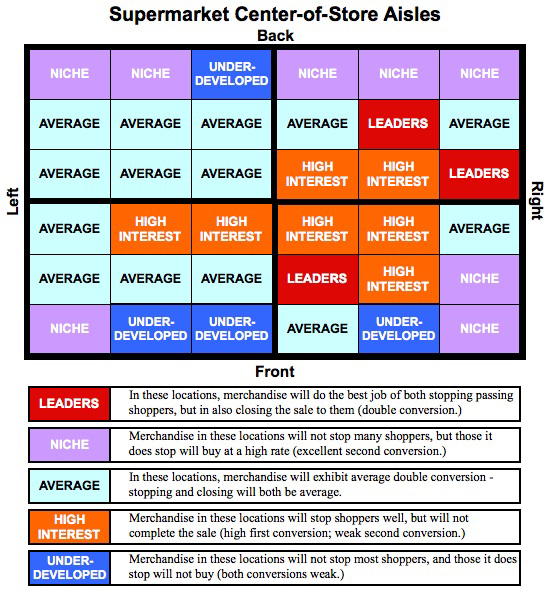
To understand this performance diagram, consider how double conversion works. When shoppers move past merchandise, in order for sales to occur, the merchandise must induce the shoppers to stop, not just keep walking. This is stopping power, the first conversion. Then the merchandise must close the sale, by inducing the shopper to select and remove the merchandise. This is closing power, the second conversion. Of course, before either of these conversions can occur, the shopper must visit the immediate area of the merchandise. This constitutes reach for the merchandise. The fourth metric is time, that is, how long each of these other three take, in seconds.
For our purposes here, it is probably sufficient to note that leader and niche status are the most valuable, because both of them are good at completing the sale, although niche is not very good at engaging the traffic that goes by. On the other hand, high interest exhibits a lot of stopping power, but doesn't complete the sale. Those who have seen these classifications before have probably seen them related to categories, not locations. There is a reason that everything related to a sale is ordinarily associated with the products: the whole world, shoppers, retailers and their brand suppliers, think that shopping is about the people and products. IT'S NOT, at least in terms of shopping behavior.
Notice in this Center-of-Store Aisle study, that shopping behavior is associated with locations, not with the categories at those locations. In other words, it is the location that induces the behavior, not the products on the shelf. This is further supported by the fact that across more than a dozen stores, tracking hundreds of thousands of shopping trips across the full store - not just the center-of-store - fourteen different categories appear in at least one of the stores as a leader category. One of those, produce, was a leader in every single store. However, four of the categories were leaders in only a single store: candy, crackers, ethnic foods and pet foods. All four of these have significant presence in the center-of-store, and once you realize that only three of the thirty six center-of-store locations consistently produce leader results, it's not hard to understand how a lot more categories than perimeter categories can be leaders. Other than those already mentioned, canned vegetables, frozen dinners and salty snacks also showed up as leaders for the full store. This means there are locations (indicated in the diagram,) that are as valuable, if not more valuable, than many end-caps. Fascinating potential here for managing sales! (Note that all three of these leader areas are in the right half of the center of store, suggesting that the U-turn discussed in Tell 'em Where to Go; Tell 'em Which to Buy! may be driving this "leader" behavior.)
Display Domains. Now for explanatory caveats, and expansion beyond the geography domain. Note that in selecting a set of congruent stores for the center-of-store study, the selection of stores was deliberately constrained to assure some constancy of the types of displays. This is because of the recognition of the huge impact that varying display structures have on the shopping experience. A 2004 plan for modeling center-of-store aisles, identified the following behavioral domains, that is, display environments that virtually require shopper behavior distinct from that occurring in other environments.
- Race-track [perimeter] - exclusive of the following
- Center-of-Store Aisles - constrained straight path
- End-caps - 6ft radius
- Checkout - 6ft radius of entry to lanes
- Bazaar - produce/other non-forced paths with tables not blocking the view
- Service - requires assistance from staff
- Serpentine - constrained non-straight path
- Remainder - whatever is left
Each of these domains is significantly different from the others, on simple inspection, so that there is no reason to expect shopper behavior to be identical from domain to domain in any given store, or across stores.
Initial modeling of the center-of-store aisles was undertaken because of the large number of very similar aisles, in terms of width and length, that were available for modeling. The remainder of the store areas were judged similar enough from store to store, that variation in the non-center-of-store areas would have minimal impact on the center-of-store. Subsequent successful modeling of large numbers of end-caps across even more stores, confirmed that at least those two display domains could be successfully modeled. In fact, in both cases a mathematical model could successfully report category performance across display configurations, based on past performance in similar or related locations. This provides a means for management to conduct virtual experiments with "what if" placements to see monetary and behavioral results, without the cost or inconvenience of physically moving displays.
Summary
Given the huge impact on shopper behavior, driven by geographic location and the type of display for the merchandise, talking about item or category performance without specifying both of these domains, seems very inadequate for nearly any purpose. For example, saying it takes 16 seconds for shoppers to purchase a specific product or category is nearly meaningless without specifying both the display type, and its geographic location. It is not a trivial matter that within a store the shopper exists in a space/time continuum, that is warped across the store, and altered by the presence of the various display types.
Both retailers and their suppliers are woefully deficient in understanding the fundamental science of shopper behavior. Two examples: one of the top five global retailers, after being presented with the data on the relation of time efficiency to store sales commented: "Time doesn't matter, all that matters is the price, and whether the shopper enjoyed the trip." Another senior shopper researcher from one of the top five global brands, after hearing how the location being observed was impacting the behavior of shoppers said: "Oh, that's just background noise."
This level of superficiality in thinking about the shoppers' behaviors is not unusual. Major advances in retail performance are obviously there for the taking. But they will require understanding, driven by measurements. What is not measured, will NOT be managed. Another way to say that is that if you do not measure shopper behavior continuously, you will not manage it continuously. This is the doorway to the third great retail triumph: careful attention to the efficiency of what shoppers do, just as for the efficiency of what the retailer and/or supplier does. Any other so-called "shopper centric focus" is a step away from the real source of profits.
Here's to GREAT "Shopping!"
Your friend, Herb Sorensen


