


|
I realize that I am not the only one who uses the term "shopper science," but when I use it, I am perhaps using it in a little different way. The purpose of this Views is to essentially lay out a perceptual framework, my working definition of "shopper science," from the perspective outlined in "From Opportunity to Final Purchase". For shorthand we can refer to this framework as "5D Reality," encompassing the three spatial dimensions, xyz, and adding to that t for time, and orientation, o, for the direction people and objects are facing. But there is a good deal more than simply a framework - the shopper, the store, and a great deal more play out on that framework. So we begin with the shoppers themselves... (For the serious student of shoppers... fasten your seatbelts! ;-) The Shoppers Of course, we ourselves are going to observe the shoppers, but we want to begin with what we can refer to as first person observation: in this case, the shoppers themselves and their observations. After all, this shopper science is about the shopper, not about us observing the shopper. So we are going to broaden the meaning of the shopper observing to rather referring to the shopper sensing. That is because the shopper actually "observes" in a sense, with all five of their senses - and another score of sensations. But first... Vision - OBSERVATIONS First and foremost of the senses is vision. Vision is the dominant and most important of the five senses. We'll look at some characteristics of vision that you might have thought about - maybe somebody has, but I haven't run into it before. In "The Incredibly Shrinking (In-Store) 'Audience'," we discussed the increasingly diminutive nature of seeing as you move from the wide world around the shopper to what their eyes actually focus on - give attention to. But it is obvious that the eye "sees" a great deal more than the actual point of focus. (See also the vision discussion in, "Whisper, Don't Shout (or mumble!)".) It will be instructive here to look at an analogy to the eye "looking." 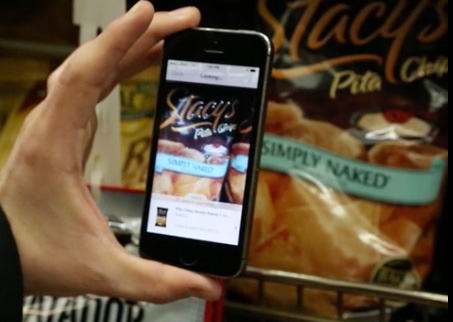
Amazon Flow is a smartphone app, that "looks" at products on the shelf, and recognizes tens of millions of products! In the photo on the right you can see tiny dots of light, primarily on the brand name of the product. These tiny dots are flashing across the scene with great rapidity, and essentially seeing what the product is. If you actually look at this in practice, the Amazon Flow looks like nothing so much as looking at the dots (or cross-hairs) from an eye-tracking video - except Amazon Flow creates new points of focus much more rapidly than the eye creates new points of focus. If you know something about how the mind captures a scene from an eye, it is obvious that there is at least an apparent similarity between how image recognition software works, and how the eye works. But bear in mind that whatever camera is feeding the image recognition, the image is simply a large array of light waves of varying frequency and intensity, striking the photoreceptors of eye or camera. There is a crucial point here to be made. From birth on our eyes/brains learn very quickly how to process images and store, not the images per se but something that is in reality more like mathematical descriptions of those dots you see on Amazon Flow, and that all image recognition software must create arrays of data that do not actually retain the images, but instead the data arrays have the property of evoking the original image, sensed in memory so realistically to the person, that it is as if in memory the person is seeing the image anew. It is helpful to recognize that digital cameras move digitization of images from the historical frames of film photography to arrays of pixels. But note that simple raster arrays with a pixel for each xy coordinate soon were replaced with the far more efficient vector and other methods - again, evoking what is known of the brain's methods for storing visual images. Again, remember that processing visual data is job one for the brain's sensing.
So we see that frames and pixels must lie at the foundation of our observation, digitizing our perceived analog world. But that is perception only, since our eyes themselves are digital apparati! This is a consequence of the fact that our retinas are themselves digital, essentially photosensitive cellular arrays (rods and cones,) which serve the same function Big, BIG! Data Diving in more deeply, where we are going with this is that light waves are the most efficient means in the universe for conveying massive information. We have become so familiar with the process, from birth on, as to miss, possibly, the significance of the information processing going on. Moreover, over the past couple of centuries, we have found other types of waves, like electrical, radio, etc., etc., that are far more limited in their information content, but far easier for us to understand, and technically parse the pathetically limited content those waves carry (compared to light waves.) Light waves can span from the furthest reaches of the universe, to microscopic detail, with breathtaking efficiency. Light waves are directional in our receiving of them, although we are continuously bathed in an incredible variety of color and light, contrasts, inflection points, patterns, etc., etc. No wonder the mass of location apps and companies are "focusing" on the pathetically limited wifi signals, cellular signals, magnetic fields, or other electromagnetic emanations that, as a consequence of their limited information content, are simple to parse and analyze - in comparison to the far more complex (and informative,) visual information bathing us, anyone and anywhere, and anything, all the time. There is a reason that 90+% of ALL sensory data arriving in the brain comes from the eyes. The introduction of the concept of BIG data, is diminutive in comparison to the massive generation and processing of light waves throughout the universe, and so familiar to all sighted beings that recognizing its worth has advanced much further in the world of art than in the world of science. Ahem! 
I hope from all this that you get an expanded appreciation for the technical and scientific possibilities that can arise from a method to capture all the information that is essentially flooding the world, carried by light waves, that we have poorly mastered, to date, but for which companies like Amazon, with their Flow app, and image recognition scientist using neural net processing, with not just Amazonian capabilities to recognize shopper behavior, but far transcending with data and analytics of our own earlier PathTracker® and vision path methods. Like others, just learning something about how to observe, measure and think about shoppers, I needed to first begin with far more limited source data (RFID for foot paths; point-of-focus tracking for eye paths.) But we are now ready to address a far more versatile and complete data source - the light we are bathed in! The "Vision Scroll" Before we deal with the other four senses (plus!) - we need to provide the process whereby we can use vision to actually create a 5D reality data map. Think of it as filling all the empty space surrounding those foot-paths and eye-paths I have spent the past 15 years: measuring, digitizing the store's xy grid, now digitizing all space (xyzto,), parameterizing, and translating into a true shopper science. One way of beginning an integral understanding of all we see is to first convert the great moving parade passing before our eyes into a flat, two dimensional surface. Think of it as any flat 2D photo, only in this case, continuing as long and as far as your own daily viewing of the world around you. Never mind, for the moment, the 3 dimensional aspects afforded by looking with two eyes, or even the natural depth perception of a single eye, contextually interpreting relative sizes, order of appearance, etc., from the changing scene. The scene can be changing because of either changes in the scene, or changes in the first person viewer - position, orientation, etc. For now it suffices to consider the "vision scroll" to be a continuous, 2 dimensional, accurate representation of all the light rays striking the eye of a single observer over any given period of time, whether of a short or long shopping trip, or any other period or environment of interest. The actual scroll is more or less a continuous panoramic photo, with the world within your field of view continuously connected over time. Here's three successive frames from a supermarket scene as seen through the eyes of the shopper: 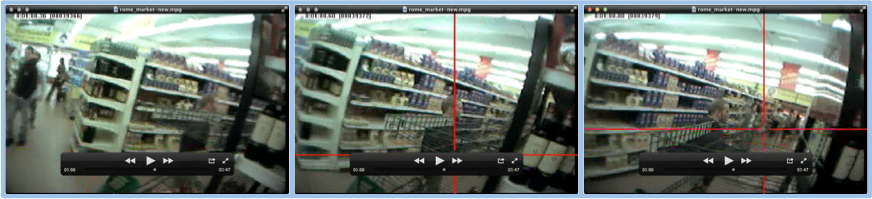
In the first scene the shopper is approaching an aisle entrance with an end cap on the left and on the right; in the second scene, moving into the aisle; third scene, in the aisle. Below you can see a series of consecutive frames overlaid to align frame on frame. This also illustrates the necessity of deforming images in order to get a perfect fit. Using identical computer recognized features across two or more frames is the key to this process. 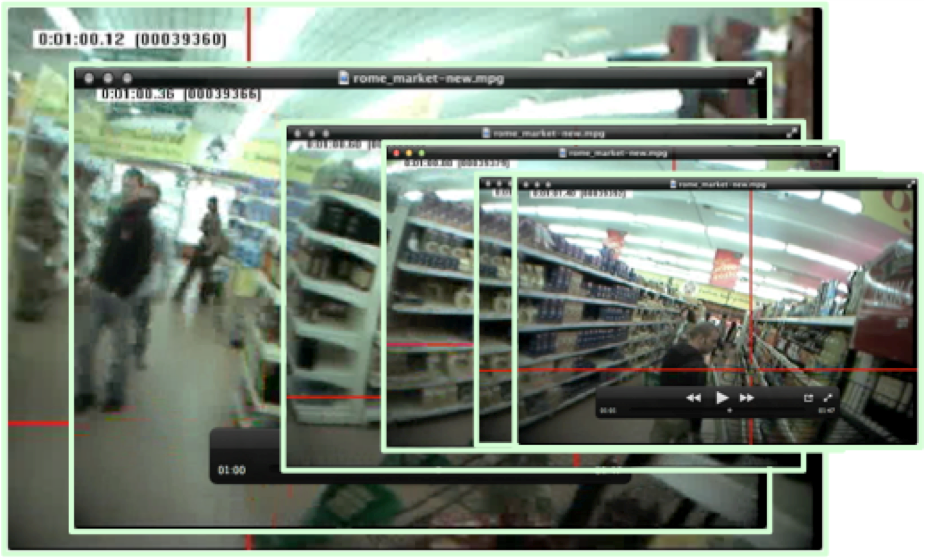
This should give some concept of the construction of the basic visual of the "vision scroll." Even though we mostly get along without having actual vision scrolls, the reality is that any head mounted video camera actually produces the raw images that constitute the vision scroll. However, for research purposes, actually stitching together the images as noted here is essential to the future wide-spread use of visual data, xyzto, in numeric database form. This is a crucial distinction, as capturing and digitizing the raw data as first person video already exists in the thousands of hours of head mounted camera video, and is readily added to by any of the field-of-vision head mounted camera equipment including a wide array of helmet-cams commonly used in a variety of sporting activities, and certainly all of the eye-tracking video accrued over decades of formal research. I created the HyperEyeCam myself, several years ago, to expedite visual research of the shopper population - Point of view shopper camera system with orientation sensor. More recently, GoogleGlass has provided a convenient tool for producing video of this type, by the general population. The point at this point is that vision provides the raw material of the most massive data set, probably in the universe. Secondly, that raw material has been accumulating at least since the invention of photography, and passed major milestones when it incorporated color and motion, and later was digitized. We are now moving into an era of ubiquitous production of these raw records, with totally inadequate means to analyze and transmute this data, unlocking untold wealth in knowledge and insight - beginning with shoppers. So now we turn to the process for transforming the raw material, beginning with annotation of the vision scroll! Annotation of the "Vision Scroll" - MEASUREMENTS and "5D Reality" The key to unlocking data from the vision scroll is what I refer to as "5D Reality." What this means is that every single pixel on the vision scroll has x, y and z coordinates which can be related to any universal coordinate system, such as longitude, latitude and altitude; radial coordinates, or any other transformable system. Ultimately, single numbers for xyz will become adequate, with perhaps decimal points representing statistical reliability. (Note: Absent a high degree of accuracy, there will still be massive learnings from imperfect data. Understand that our first PathTracker® installation was advertised by the RFID supplier as having an accuracy of 5-10ft. In practice we found 10-30ft. to be more realistic. Over the following ten years we ultimately achieved accuracy better than originally advertised. However, none of this denied us the opportunity to learn many foundational shopper principles, that continue to hold true with subsequent massive confirmation.) It can be understood that vision scroll accuracy will have some similar accuracy evolution, but beginning at a much higher level as a consequence of the greater precision of vision, plus our prior evolution of understanding. The fourth dimension is time, t, about which I have written before:
[Sorensen, Herb Ph.D. (2009-04-29). Inside the Mind of the Shopper: The Science of Retailing (Kindle Locations 1292-1305). Pearson Education (US). Kindle Edition.] The fifth "dimension" is not really a dimension, but rather a vector describing the orientation, o, of either a person or a display. The value of this is to know exactly the orientation of any identified object on the vision scroll, but also to know the orientation (and location) of the first person observer that is creating the vision scroll. The "5D Reality" generalized here can be integrated directly into computations of in-store advertising exposures. See also: Purchase selection behavior analysis system and method utilizing a visibility measure. Once "5D Reality" has been measured for all objects in the environment, over all time of consideration, all remaining shopper behavioral metrics can be derived from this exhaustive data set. However, just as accuracy does not need to be absolute, so too a very parsimonious database may be adequate to deliver relevant shopper metrics of interest. Observing/Measuring Fixed Data Observing and measuring is not just about the shopper, but also about the shopper's environment. We often refer to this as store infrastructure, all the stuff in the store, and the store itself, that changes very little, or not very often. Actually, given their very low turnover, a high percentage of the store's merchandise is hardly distinguished from infrastructure. But, most importantly, the store's design, layout and merchandising are often already available in 3D CAD maps and planograms. Even if not available, these can be produced on an ad hoc basis for relatively modest cost per store, with periodic audits verifying and editing to keep this information up to date. 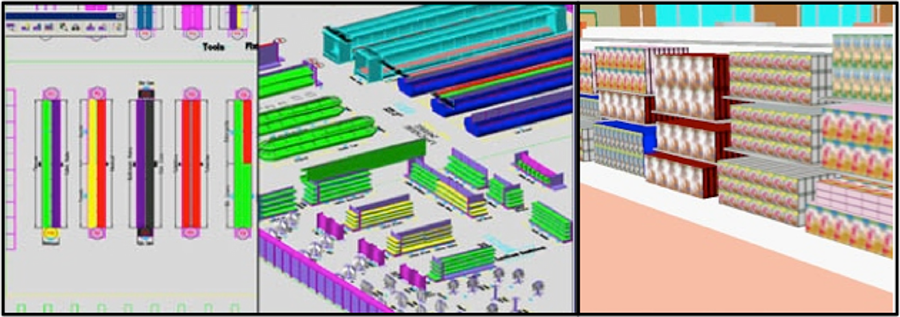
What this means is that every xyz on these maps can and should be known before presuming to study the interaction of shoppers with these. (The periodic audits keep this data refreshed.) To flesh out the shopper study paradigm, we need to give further consideration to the three persons in our observational framework. The Three "Persons" in Shopper Observation We have already mentioned that the shopper is the "first person" of shopping. And it is fortuitous that since 1879, scientists have been studying the movement of the eyes while the "first person" is engaging in some activity - originally, reading; and now, not uncommonly, shopping. The scientist is of course, in this case, the second person. 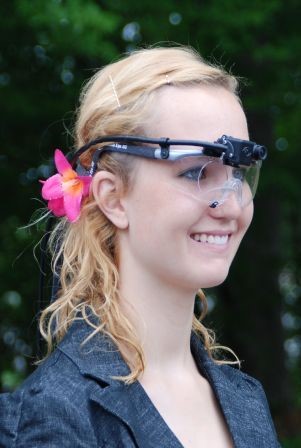
Clearly, the best way to actually see what the shopper is seeing, and tracking what is there, that they are looking at, is with something like the ASL MobileEye device. A camera captures what is seen, and a corneal reflection pin-points the exact point of focus. But this type of equipment, though definitive for a select sampling of shoppers, isn't relevant to the need to observe hundreds, thousands or tens of thousands of shoppers. In the case of the MobileEye, the second person is essentially looking through "the same eyes" as the first person, so even though two people are involved, it is really only one, the first person, whose vision is involved. The type of "second person" observation of the shopper is more like looking at secondary data of the RFID, WiFI, BlueTooth or other sensing, only in our case we rely on the far richer, and more informative, surveillance cameras, that capture a good deal more data than those thin data sources even imagine. Rather, the richness of the data is limited only to the resolution of the camera(s), and our ability to parse the digital pixel array of a fixed surveillance camera. This is orders of magnitude simpler than parsing the first person video, for the simple reason that the second person video is mostly static, with only the shoppers, staff, shoplifters, etc., moving, plus those products actually removed from the shelf - which should correlate nearly perfectly with the store's own transaction log. To see how the products purchased show up in this second person video, consider the following series of frames taken by a "surveillance" camera of a shelf display: 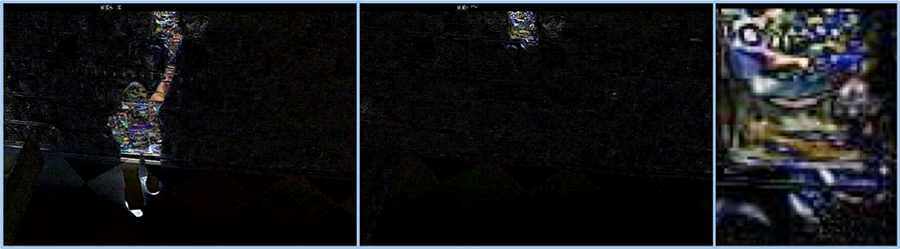
All of these frames are negatives of what the camera actually saw. In other words, that first frame is actually created by taking the frame with the image after the shopper appeared and had reached up and moved the package, and subtracting the image before the shopper had appeared. Hence, all the subtraction shows is what looks different on the shelf - packages the persons "shadow" hides, plus the package the hand has moved. After the shopper leaves, with the package, the subtracted image on the shelf is shown in the second frame, and magnified in the third frame, where it can be recognized as a package of Tostitos! This subtractive methodology, across series of "second person" photos, is invaluable for simply detecting what has changed. The extreme difficulty of automated analysis of mobile head mounted camera data is that every step in the store nearly completely changes the scene, and not just what is being looked at. There is simply NO constancy from frame to frame - everything is moving. The entire field of view undergoes massive "churn" as a shopper walks down any aisle, with a panoply of merchandise and fixtures irregularly appearing and disappearing from their sight as they move and turn from side to side. Not until they have zoomed in on a likely purchase does the background field steady, and for a few seconds, the shopper zeros in on the features of greatest interest, culminating in the purchase - or not! See: "From Opportunity to Final Purchase". Instead, the second person view from a surveillance camera is more like an oval selection from the 3D CAD map/planogram illustrated above. Assigning xyz and orientation to every single pixel on the surface of the 3D CAD map and planograms is a relatively trivial task, given that both the CAD map and planograms are already digitized, with some form of xyz already an integral part of those files, requiring only harmonization with the full-store xyz (and orientation) we are using for our shopper observation. The bottom line is that creating a harmonious 5D Reality map of the store, it's fixtures and merchandise is a matter of pulling together existing data into this more coherent and universal data structure. This leaves the 5D Reality map of the shopper, continuous throughout their shopping trip - including items purchased, requires only recognizing perturbations in the surveillance videos - the constant parts already harmonized with the constant store infrastructure. Representing shoppers can be simplified by superimposing on their images "stick shoppers" that continuously have their "Stick 5D Reality" recorded - that is, every second or at other set frequency, vector graphics of the shopper's corresponding stick can be entered into the database with the corresponding time, t, and orientation, o. In addition, specific characteristics of the shopper can be associated with figure - height, weight, age, gender, ethnicity, or other features. 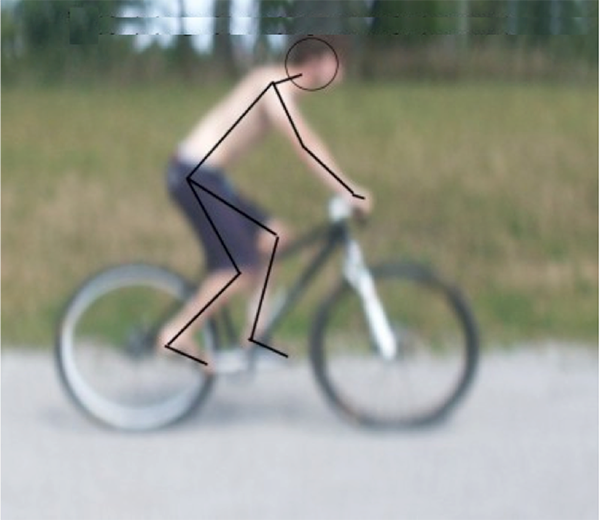
Privacy can be dealt with flexibly, all the way from personal identity in a permission-based system, or nothing more than age, gender and height. The "stick shoppers" are an important component of using the second person view to impute a first person view. Having the location and orientation of the head and eyes on a frame by frame basis from the second person view, allows computation of the probable field of view, including the probable point of focus. It is simply a matter of projecting a visual cone onto the store's 5D Reality of architecture, fixtures and products. The potential for including other people in the projection, whether other shoppers, staff or otherwise, should be obvious. Note that the imputation here from the second person, surveillance view, relies on the same principles of probability as leveraged in: Purchase selection behavior analysis system and method utilizing a visibility measure. An important feature of all my shopper research needs to be noted here. First is the shopper "crowd," which for a single store might vary from a few thousand to a few hundred thousand people. As the "owner" of the store, I am interested in the big picture - and want to provide the maximum of value to the maximum number of people. We have truckloads of data showing that what any 5,000 people want and do is pretty much what any other group of 5,000 people want or do. Understanding this crowd behavior is the key to proper management of the self-service retail establishment. Once we have a very good handle on the performance of the crowd, then, and only then, do we deep dive for the minutest details of individual members of the crowd - always with the goal of learning how those details, when summed up across all the members of the crowd, reproduce very closely the absolute truths we have already established about the crowd! So... this zooming in... and then zooming out... repeatedly... provides an unparalleled view of the shopper. Notice that a substantial sampling of the first person view of shopping will provide a wealth of fine detail of the type foreseen in "From Opportunity to Final Purchase". At the same time, the massive data capture of thousands of shopping trips in the second person view - watching first person shoppers - generates massive crowd statistics, with details congruent to the measured first person views. In addition, the imputed first person views, imputed from the second person views, provides the potential for order of magnitude increases in first person views (imputed.) The reliability of this imputed data can be assessed by ongoing sampling of actual measured first person views, using MobileEye methodology. Also, it might be appreciated that the annotated vision scroll can also be annotated with all other detected senses/sensations. For example, recording sound clips at the points where they are heard by a shopper, can be associated with the fields of xyz, across the t's applicable. This addition to the database, as well as any other senses/sensations, opens the door to understanding observed human behavior, almost beyond imagining. The Third "Person" in Shopper Observation When we built the original PathTracker® databases, incorporating RFID path data for hundreds of thousands of shopping trips across a growing sampling of chains, we hit a wall with querying our databases - with sometimes a query running for more than a day - and then crashing, and needing to start over. The solution to this problem was to migrate our data into OLAP cubes, essentially prestructured to accommodate a wide variety of the types of queries we would most likely want to make. Suddenly our queries were running smoothly, allowing us wide ranging access to data never before seen. You can see a small sampling in "Shopping Category Norms"; "The Power of Atlas"; "The Three Shopping Currencies." The point is that these three documents, as detailed and laboriously produced as they were, from data accrued from millions of dollars of investment, still only scratch the surface of the original PathTracker® work. However, all three of these documents essentially present "third person" analysis, because the data exists in databases that could have been searched and analyzed by anyone with the requisite mathematical and analytical skills. This is the ultimate use of the carefully structured, unambiguous database being created from second person observation of shoppers, validated by sampling first person vision, and all organized and reduced to bits and bytes that third persons may search at will - advancing the thinking about shoppers based on voluminous and validated observation and measurement.
Here's to GREAT "Shopping" for YOU!!! |
 as the pixel arrays of digital cameras. Frames, the link to the fourth dimension - time - are more easily recognized in digital movie cameras. However, herky-jerky movement of the eyes' fixations shows that the eye uses a parallel concept of time, the fixations of the eye paralleling the frames of the movie, whether the frames themselves are digitized or celluloid, the principle is that each frame (fixation) corresponds to a unit of time. The role of peripheral vision - crucial in shopping -will be discussed later. But it is mentioned here because fixations are highly focused points, related to mental attention, whether conscious or subconscious, but fixations are by no means identical to mental attention. Witness the skills of covert agents who are trained to "see" a great deal in a room, without ever giving it their overt attention by actually focusing their eyes on what they are mentally giving attention to.