|
From Opportunity to Final Purchase This issue of the Views is a follow-on to the previous issue, The Incredibly Shrinking (In-Store) "Audience". The "tame" vs. "wild" audience concept described there is a key to more effective deployment of literally billions of dollars of in-store advertising and promotional money. The "shrinkage" mentioned refers to our understanding of the diminutive nature of what communication actually gets through to the shopper. There is confirmation that, "any exposure that creates an impression that leads to a sale is a worthwhile exposure." See: "Long Tail Media In the Store." This issue of the Views reads the shoppers' minds by looking through the shoppers' own eyes during the final purchase process. This is essential to understanding of exactly what process the shopper's mind goes through in making the final decision of moving a product from consideration on a display shelf, into the shopping basket. Until we are able to automate the analytical process illustrated here, the data presented, though limited, is simply our first faint objective glimmer of what is going on in the shopper's mind while they make a purchase. Through collaboration with Hyperlayer and their computer vision recognition processes, we are pressing the science of shopping forward.
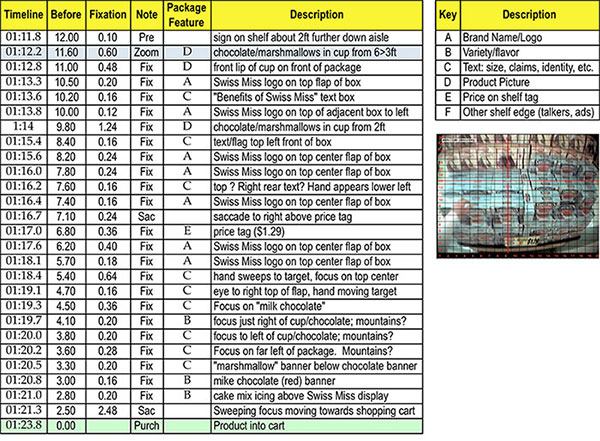
Here's to GREAT "Shopping" for YOU!!! From Opportunity to Final Purchase Background and Introduction Beginning with the exact instant a purchase occurs — product into the basket — we move back by the tenth second, asking and answering, "What preceded or led to, that?" This level of serial detail is feasible for the one to few dozen seconds immediately preceding the purchase. A progressive series of antecedents can lead us back to the point at which the shopper addresses the shelf-set or display where the purchase will ultimately occur. Purchase decisions are not single events, but rather an inter-related series of micro-events — a process — what the brain sees through the eyes. During this final selection process, the shopper's position is relatively fixed, and attention is focused on product and display features that lead to the final selection, from whatever suite of products/options are immediately before the shopper. The behavior that precedes the purchase, for example navigation through the store up to the exact point of purchase, interrupted by other prior purchases or events, back to store entry, are more feasibly studied, classified and analyzed on a second by second basis. The second by second analysis of the full shopping trip within the store is the scope of our Visual Trip Deconstruction project. The project overlays a decade of tracking millions of shopping foot paths on a second by second basis, from entry to exit, visiting, shopping and purchasing. The added detail provided by seeing through the shoppers' eyes, down to the detail of the autonomic movement of the visual point of focus, affords growing insight into the behavior and minds of shoppers. With 90% of all sensory input coming through the eyes, (Jensen, 2008) this study provides a stable skeletal framework upon which to build the ultimate comprehensive understanding of shopper behavior — the shopper T.O.E., Theory Of Everything — borrowing from the physicists. (Wikipedia, 2012) For the marketer seeking to sell to shoppers, it is appropriate to begin at the entrance of the store because that is where the eyes begin their pilot duty of guiding the shopper through navigation and selection, but also because marketers/advertisers have long relied on the metrics of reach and frequency to gauge the magnitude of their potential to sell to audiences. For at least a decade, there has been a desire to create audience metrics that can transcend all major forms of advertising: television, internet and retail stores being prominent examples. Television and its metrics have long been the gold standard for media metrics, and as a matter of practicality, long relied on the concept of "opportunity to see" (OTS, Wikipedia.) That is, the "audience" was measured by all those who had an opportunity to see the media in consideration, whether they actually did or not, and frequency was how many times they had the opportunity, not whether they actually did. The advent of internet advertising has forced a shift from opportunity to actual counts and durations of clicks, page views and other direct metrics, (comScore) at least for that milieu. The in-store schema outlined here, matches more closely the internet model, than the television model. The shopper's point-by-point progress through the store, is a veritable "click stream" of behavior, including "page views" and similar features. (Fader, 2009) These considerations leave open the potential for harmonizing in-store "media" metrics with both those of television and those of the internet, and any other media amenable to direct measurement of "exposures." Our focus here then is on relating the opportunity metrics of television, to the direct measurements of the in-store audience, as they are manifested through reach and frequency of all the trips in the store. Method We begin with the quadrillion seconds (roughly) that shoppers spend in stores every year. Each one of those seconds provides, not only an "opportunity to see," but more importantly, an "opportunity to buy/sell." Prior work has shown that only about 20% of the shopper's time in the store is spent facing the shelf, making the final selection/purchase. (Sorensen, 2003; Hui, 2008) The other 80% is spent finding locations/categories of potential interest, and scanning/searching those locations to find the specific shelf-set/display where the selection/purchase will occur. The 80% also includes other trip "overhead:" entry of the store, initial orientation, procurement of a cart or basket (if needed,) non-seeking activities, waiting, checkout and exit. The study reported here is of that final selection/purchase segment, which for the purchases here averaged, overall, 24 seconds from facing the shelf display to placing the product into the cart or basket. As noted, we are reading the shopper's mind, from the brain's final point of focus/attention, back to the beginning of their attention/focus, on the immediate consideration set, from which the purchase is finally selected. Given the novelty of the data, and the analytical strategy, it is worthwhile to examine a snippet, data for a single purchase, as recorded from eye-track video, with cross hairs marking the exact point of focus, as determined from the recorded corneal reflection. (Duchowski, 2007)
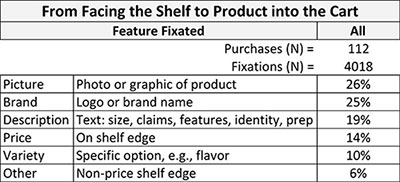
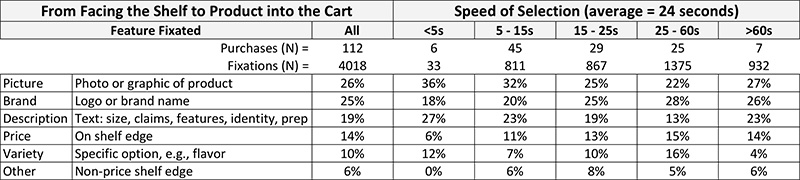
This specific purchase of Swiss Miss chocolate drink mix begins with zooming in on the chocolate and marshmallows in the cup pictured on the package, exactly 11.6 seconds "before" the product went into the cart, purchase. This countdown record shows the series of fixations, attention, that led to this purchase, and the package feature that was the object of the brain's attention, through the eye. Additional information, not shown or reported here, includes the geographic coordinates of the fixation, xy, on the shelf display that the shopper is assessing. This data, as well as six sided photos of all the products, along with the original eye track video may be a rich source for additional study. The dataset for this study includes over 9000 lines of compiled data, including 4,018 fixations across 112 individual item purchases. Results - Overview Reading these shoppers minds, through their focusing during purchase, shows the relative amount of attention to each of the six stimuli:
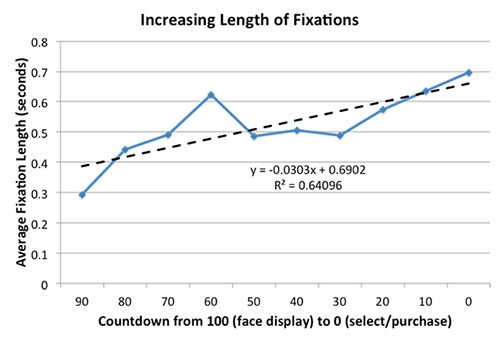
The share of these 4000+ fixations across 100+ purchases shows the extent to which the mind is accessing data from that stimulus. Note that the eye can only fixate a single point at a time, so even the 6% on shelf edge stimulus (non-price) indicates some influence, at least amongst some of the products. This data shows clearly that the majority of the input to the brain is coming from either a graphic element, photo or picture of the product - 26%; or the brand, either as logo, symbol or name - 25%. Descriptive text is the next largest eye to brain input - 19%; followed by the shelf edge issues, price - 14% and other non-price communication on the shelf edge - 6%. In combination, these two shelf edge factors have about as much weight as the descriptive text. In fact, the non-picture, non-brand stimuli, if all subsumed under the classification "text," have about as much influence as picture and brand together, and if brand itself is textual in nature, fully three fourths of the final guidance from locking onto the shelf to placement of the product into the basket, may be driven by text, in one form or another. If true, this would suggest a high level of cognitive, rather than emotional, involvement in the final "closing of the sale," that is, getting the customer's "name on the dotted line," in contractual terms. Since color/shape graphic elements are widely believed to play a major role in the purchase (Scammell-Katz, 2012,) it seems likely that those graphic elements play a larger role in guiding the shopper to the final point of sale, with, perhaps, textual elements playing more of a "confirming" the sale role, moving the product into the cart or basket. Some evidence of this may be found in the evolving attention to the enumerated stimuli as the shopper moves from confronting the final display where the selection/purchase will be made, to the actual purchase. Notice, for example, the progressively longer fixations as the shopper approaches the purchase:
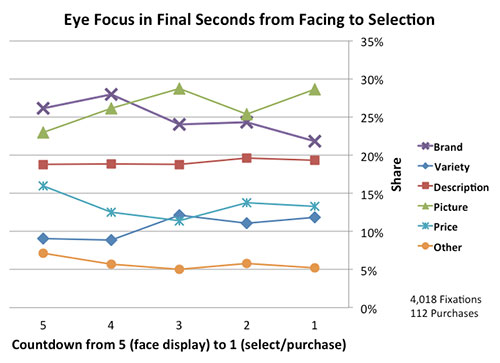
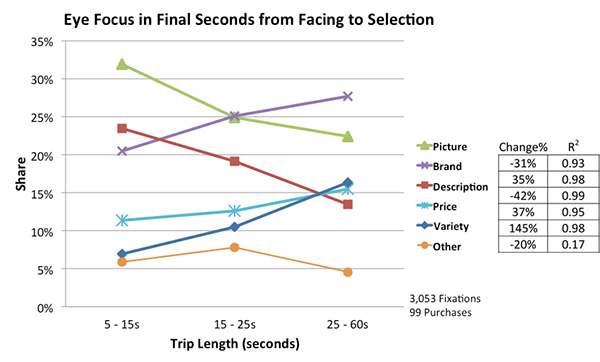
This chart shows us that from the beginning of the countdown until the purchase occurs, the average length of fixations approximately doubles, suggesting that the shopper's brain is dwelling longer and longer, with each subsequent fixation, on whatever is attracting their attention. In fact, the graph superficially suggests that the first 40% of the purchase countdown results in a doubling of fixation lengths (average of less than 0.3 seconds to more than 0.6 seconds,) while the last 60% resets the length of fixations and increases them from about 0.5 seconds to more than 0.7 seconds. The data is probably not sufficiently robust to make that conclusion, but the correlation of 0.64 for the full dataset justifies concluding a near doubling of average fixation time from facing the display to final purchase. Whatever the brain is giving attention to, is getting that attention in larger and larger chunks, as the final decision process is being completed. The trends of attentional focus for the stimuli, for the aggregate sample of 100+ purchases and 4000+ fixations are shown below. But first, some notation of the method for aggregating the purchase process for widely disparate purchases, among a dozen shoppers, across multiple categories, and with widely varying elapsed times from initial to final fixation. We will examine the impact of elapsed purchase time, demographic, geographic and category factors, after assessing all in aggregate, but without ignoring the heterogeneity of the underlying dataset. The aggregation is accomplished by normalizing the elapsed time of each purchase from 100 to zero, initial facing the display as 100 to the final selection as zero. For some graphs we express these in five quintiles for convenience, and to maintaining at least some time aggregation (as the above graph was plotted in deciles, for the same reason.) The only common factor in the aggregate set is that, every purchase was made by a real shopper, in a real store, on a semi-normal shopping trip. The "semi-normal" is a qualification, since most of these shoppers were pre-recruited to come to the store to participate in the research, without specifying the process to them, in any detail. With those caveats, here are the aggregate trends in visual fixations, mental attentions, for the aggregate sample:
This chart indicates that the brand (possibly even as a text element) dominates the first two quintiles of the aggregate purchase, with 25-30% of the mental attention, while the graphic or picture element grows in the number of fixations, and presumably their length from about 23% of the fixations when initially addressing the display, to 28% at the point of selection/purchase. Whether the switch in dominance from brand to graphic meaningfully correlates with the apparent shift in length of individual fixations noted earlier, is uncertain. However, if true, it may derive from the greater visual richness of a graphic, inviting a more lingering fixation, than from a more textual brand representation. However we might classify the stimuli (text vs. graphic image,) it remains that brand identity is the dominant fixation of the eye and mind in beginning the "close" of the sale, followed closely by any graphic, visual element, which captures a progressively greater share of attention, right up to the close. These two visual elements, brand and graphic, constitute half the visual, and thence the mental, attention in the final purchase process, the close of the sale. Textual descriptive material is a relatively constant near 20% fixations, with price beginning at 16%, falling to about 12%, and rising slightly to end near 14%. Having price as a significant, continuing focus in the final sale close may suggest early notice, and possibly continuing reassurance of the value. Having the variety or flavor rise as a matter of consideration, as the denouement approaches, would suggest it is not an early concern, but becomes crucial in determining which of the flavor options will go into the cart or basket. Given the novelty and limitations of the data, these comments are not intended to be conclusive, but to simply put an intelligible and consistent interpretation on the observations as they now stand. Results: Length (seconds) of Purchases Clearly, normalized trips of widely varying lengths, are likely to have very different purchase deconstruction profiles, relative to the various stimuli catalogued. For example, purchases made in 5 seconds or less, must, perforce, involve a lot less consideration than those taking well over 60 seconds. This is reflected in the 5.5 fixations per purchase - one or two per second for the few "grab and go" purchases vs. the 133 fixations per purchase for the 60+ second purchases - again, one or two per second, depending on just how many seconds for the purchase were required.
If we use what we learned about averaging 1.5 fixations per second, across all purchases, then it is obvious that if it takes longer for a shopper to make their purchase, they will have invested more fixations on the purchase. This is a direct measure of mental effort, in coming to the point of decision, and putting the product in the cart or basket. Where that investment is made, in terms of increasing fixations, is interesting:
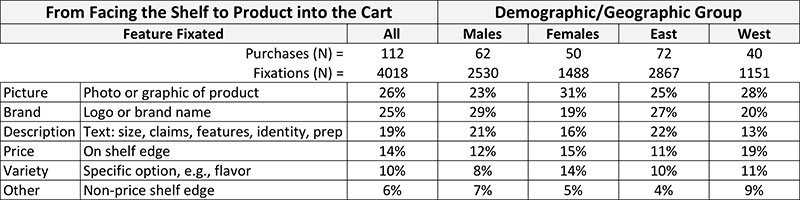
Attention to the graphic or picture and to the descriptive text is seriously eroding as the purchase takes longer -31% and -42% relative decreases, respectively. On the other hand, the brand and price are both attracting a lot more attention — about a third more mental activity for each. Choice of variety becomes much more critical in purchases of long duration, and may be a causal for the length. This last observation harmonizes with prior observations that categories that take a long time to purchase, often have lots of smaller packages with lots of options in terms of variety. (Sorensen, 2003) Examples would include baby food, canned soup, yogurt, spices and over-the-counter (OTC) medications. This also explains the observation that the faster you sell, the more you will sell. The rising focus on price that occurs with the longer purchases may be as much a search for a reason to buy, since, from the example categories cited, confusion may be a major contributor to purchase length. Alternatively, these very long selection times may reflect some level of resistance to the price, which could explain the increasing role of price in purchases taking a long time to make. Results: Demographic and Geographic Effects Although the total fixation database is large, the potential for parsing it into demographic or geographic subsets is limited, however, interesting. For example:
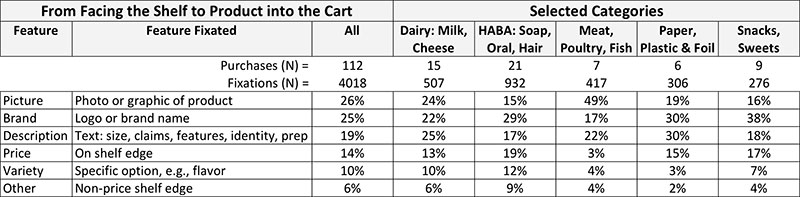
Consider first the male/female factor. It seems likely that females are more influenced by the product graphic, while males are more influenced by the brand identification. The other gender issue seems that males are less likely to select a flavor, while females spend time distinguishing the options. With females averaging significantly fewer fixations per purchase, 30, perhaps the graphic is more efficiently recognized, with the brand being less efficient - males average 41 fixations per purchase. Perhaps females use their lesser quota of text fixations in giving attention to choice of variety. The east/west balance may be better explained by the differences in the stores than differences in the populations. The larger number of purchases in the east are largely a consequence of individual shoppers there purchasing more items, and investing more fixations per item. One store factor that could have contributed to this is that the eastern store was a dual entry store (both left and right entries) while the western store was a single entry/exit location, on the left. Left entry stores typically perform more poorly than right entry stores. (Sorensen, 2003) Although the author was present during fielding in both stores, no formal measurements were made of the stores, and so these comments can only be offered as hypothesis. Results: Category Effects Although shoppers do not purchase categories, as individuals, but rather purchase, typically, a single item in a category, nonetheless, items across categories often share some shopping characteristics. This visual purchase deconstruction work is focused on detailed individual purchases, with the first level of analysis coming from aggregation of all the purchases, looking for commonality, with those results catalogued above. Here we look at items grouped by their supposed affinity characteristics — categories. Ultimately, visual deconstruction work needs to be done at the item level, with sufficient measures repeated for single SKUs in quantity sufficient to understand those individual items. Then the characteristics of the category, if that is proper, can be formulated from detailed, accurate understanding of properly selected, multiple items as representative of the category. But parsing the present gross and limited aggregation can suggest something of the working of the eye/brain partnership, related to some broad categories.
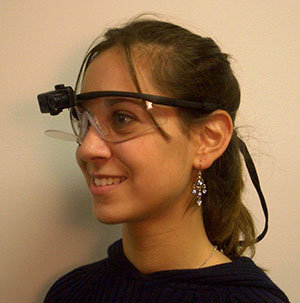
First, the role of the product graphic varies widely, with fresh meat-poultry-fish purchases dominated by this type of fixation, constituting nearly half of all the visual/mental attention required for these purchases. Of course, the appearance of these fresh products is dominated by the products, themselves. This contrasts with health-and-beauty products where there is often no serious visual graphic of any kind, the same being largely true of packaged candy, although other snacks may show the product in at least partially transparent packaging. Snacks and sweets, on the other hand, are dominated by the brand logo or name. Branding is much less significant for fresh meat, etc., and for dairy products. Both Dairy and paper products are distinguished by extra visual and mental attention to textual descriptions. Health and beauty seems to attract the most focus on price. These are more likely to be acquired on longer trips, which also showed increased interest in price and variety/choices. Summary and Conclusions Shoppers spend a quadrillion (order of magnitude,) seconds in stores around the world every year. Those seconds are the raw material for creating the $15 trillion dollars in retail sales annually (non-automotive.) The ratio of those two numbers, seconds per dollar, defines the efficiency of the retail process. Since the dollars are catalogued, willy nilly, in a variety of global economic reports, there remains the necessity of cataloguing the quadrillion seconds, as a means of understanding global retailing, especially from the perspective of the shoppers' convenience. After all, the currencies of shopping include money, time and angst, and time and money are related to angst, if not definitive of it. (Sorensen, 2012) The title of this report is "From Opportunity to Final Purchase." It is important to see the seconds shoppers spend in stores as opportunities to sell something to them. "Every second represents another opportunity to sell." We noted that television advertising — and most advertising metrics — represent opportunity-type measurements. Reach as a measurement quantifies the opportunity in terms of size of the audience, and frequency quantifies the time, or times of exposure. Times of exposure is essentially a count measure, while time (in seconds) measures the same thing as a continuous variable, rather than as a discrete variable. These comments are made to put opportunity metrics on more of a basic scientific foundation, but also to make the linkage to the final purchase, with its process measurement by counting fixations (discrete,) but also by measuring the length of the fixations (continuous.) This is important background for our second Empirical Generalization, discussed below. This present report addresses the understanding of every second, by seeing how the brain sees the final selection of items for purchase, from the moment the shopper locks onto the display where the purchase will occur to the point the selection has occurred and the shopper moves to take physical possession. As a matter of understanding, we begin with the defining moment of possession, and look to the antecedents of that moment. That is, the brain "sees" through the eyes, and receives 90% of its information from the outer world through that modality. Through capturing the shopper's field of vision by a head mounted mini video camera, and overlaying on that visual field, the exact point of focus of the eye, we learn not only what the shopper is seeing, but exactly what the brain/eye is giving attention to, through a series of fixations on features in the scene. A crucial point is that in this final selection process, what the shopper sees is relatively static, allowing assessment of a relatively fixed suite of stimuli.
As an inaugural application of the analytical method here, the coherency of the dataset, with readily understandable relations, for example, the increasing length of fixations from early in the purchase process to late in the purchase process, are encouraging, and provide a measure of confirmation of relevancy, through internal consistency. The result is at least two empirical generalizations that are likely to withstand the test of time: Empirical Generalization 1: Of six types of fixations, the brand name or logo dominates the beginning of most of the decisional continuums. (Exceptions are the continuums of unbranded products.) Graphic images, particularly of the product, closely follow brand identity and exceed the brand attention in the latter half of the continuum. Brand and graphic constitute about half of the decision continuum. Textual messages and shelf edge prices together constitute another one third of the continuum (20% for text; 13% for price.) The remaining sixth addresses varieties/flavors (10%) and non-price shelf-edge messages (6%.) Empirical Generalization 2: The "decision" to finish the purchase of a single item in a supermarket, is not an event, but rather a process. The decisional continuum begins with the shopper addressing and locking onto the display, then does not deal with one factor completely, and then another. Rather the stimulating factors are repeatedly revisited, creating a pattern of fixating/refixating on targets, over the period of time of the "close" of the sale. The pattern of lengthening fixations, with an evolving balance of fixations is the decisional continuum. The specific ratios of the fixation stimuli exhibit patterns that evolve through the decisional continuum, with patterns varying by the items and categories being purchased, the speed of purchase and demographics of the purchasers. Further development of the method, and expansion of the insights, drilling down to even single items, will likely depend on the use of image recognition software, which preliminary efforts have shown to be a potentially fruitful approach to automating what is now a very laborious, technician-dependent process. Another study pending is of the complementary data set developed as part of this study, of the balance of the shopping trip, where these purchases occurred. That data is at hand and awaits the editing and data-basing to make this type of analysis for the navigation through the store, and other portions of the shopping trip. Acknowledgments Several researchers have assisted with the compilation and cleaning of the data. Jacob Suher played the major role of assembling the data produced by the technicians. Jamin Roth is the database specialist that semi-automated the production of tables and graphs. Without their valuable contributions, this report would not have been possible. Bibliography
comScore, (2014). http://www.comscore.com
|