


Introductory note:
This issue of the Views is, as usual, fact and data driven. Beginning a decade ago, we recognized that much of the shopper behavior we were measuring was not being cognitively driven. That is, the shoppers themselves were really unaware of their own behavior, instinctive and habitual as it was. A few years ago, Mike Twitty of Unilever introduced many of us to the work of Neale Martin, Habit: The 95% of Behavior Marketers Ignore. This book provided me with a solid scientific basis, and the courage to recognize The Short Trip "Character" Hypothesis that concludes this issue of the Views (below.)
It is my pleasure to join Neale for The 3rd Annual Habit Marketing Seminar in Atlanta, Georgia on December 7, 2012, 8:00am - 12:00pm. You can download a PDF with registration and other information about Elevate Your Business with Brain Science, A Half-day Seminar.
What you do not measure... you will NOT manage
This issue of the Views presses forward our understanding of the time structure of the shopping trip in different types of retail environments. This continues work on the second currency at retail, time. [See The Three Shopping Currencies.] The importance of time became apparent more than a decade ago, beginning with the discovery that up to 80% of the shopper's time in self-service retail stores is wasted. [See The 'Traveling Salesman' Goes Shopping.] For a decade we have known that all that "lost" time provides opportunities for massive sales increases.
It is a pretense, that retailers manage shoppers; in reality,
they are more focused on managing products and real estate.
For some years we have been taking learnings from our study of millions of shopping trips around the globe, gained at great cost in time and treasure, and researching ways to measure crucial variables more efficiently, with every intention of moving retailers from a focus on sales per square foot (or meter,) to sales per unit of shoppers time. As long as the former is a primary retail metric, and the latter is not, no retailer can credibly pretend to manage shoppers... instead of real estate! This is an absolutely crucial observation that could lead, with adjustments in management methods, to massive increases in shopper efficiency (rather than real estate efficiency,) which in turn, leads to large increases in sales. Note to retailers: it is shoppers who create profits, not real estate!
As proof of this assertion, notice that Kroger, across banners, has enjoyed "35 consecutive quarters of positive identical supermarket sales" and attributes this partially to a reduction of average checkout time from, earlier, to as high as four minutes per checkout, to now, 30 seconds. (See Kroger Loses Some Wait.) This is an astounding advance, although seen in the light of the possible disappearance of checkout altogether, perhaps of less long term significance (See Apple Passbook may let you kiss wallet goodbye.) However, queue management is about a good deal more than just checkout. In the interests of predictive queue management, we have experimented with whole store (entry-to-exit) and queue measurements using infrared counters and serial still image systems, and hold a patent on aspects of same. (See Still image queue analysis system and method.)
Retailers who dominate retailing in the future will measure
and focus on the efficiency of the shoppers in their stores.
All this background is offered because of the general dearth of actually measuring shoppers and their time, the currency shoppers operationally use to make purchases. This, in turn, blinds practitioners to the fact that the shoppers' efficiency on the sales floor will most certainly drive the Third Wave of Retail. (See Efficiency & Convenience: An Introduction to "The Third Wave" of Retailing.) Those who can be expected to dominate retail as we move from $14 trillion in annual sales to $20 trillion, will not simply learn a new set of "retail tricks," or even rules, but will rationally measure and manage the time of the shoppers in their stores, to assure maximum efficiency of each second.
It is with this background in mind that we move to a consideration of the latest insights on how shoppers use their time in stores. In this instance, we are looking at their gross use of the store, the total time in their trips, trip lengths. In recent Views we introduced the concept of the trip length profile, of shoppers' trips in selected stores. We rediscovered the importance of this profile as an outgrowth of studying ways to efficiently measure the total seconds accrued by all the shoppers in individual stores. This, in turn, was done as a means of measuring how many seconds it takes each store to produce one dollar's worth of sales, i.e., seconds per dollar. This is the correct productive measure of a store - how efficiently they use whatever traffic they get, to produce sales. (See Shopper Efficiency vs. Total Store Sales.)
The "whatever traffic they get," recognizes that if you built a remote store, inaccessible to masses of shoppers, no matter how efficient it is, it isn't going to be a winner, to anyone except those few shoppers who actually get there. On the other hand, a lousy store (from the shoppers' point of view,) conveniently located and not having a lot of competition, may be a super performing store for reasons unrelated to the objective shopper experience within. This is a very important distinction, and it is issues like this that make imperative the types of detailed quantitative analysis of the underlying principles, that we favor.
Measuring total store efficiency - comparing sales
to the time spent to generate those sales.
Early in our total store tracking studies, we considered check-out transaction counts as a surrogate of store traffic. But we knew this was not exactly right because sometimes there are two shoppers feeding one basket, some "shoppers" do not go through checkout for a variety of reasons, not all of which involve shoplifting. In fact, in US stores the ratio of traffic to shoppers ranged from 1.2 to 1.8. This number skyrockets to as high as 3 to 5 in developing markets, where shopping becomes more of a family or communal activity, with multiple shoppers per basket (checkout) being the norm, rather than as a distortion of the typical one shopper per basket as in the US.
Anyway, these considerations led to the use of infrared bidirectional door counters to track not only total shopper entries and exits (they never perfectly agree,) but to compute store population on a minute-by-minute basis. This is done by mathematical integration across the hours the store is open, and delivers total minutes in the store, summed across all shoppers. Studies of this type led to, and integrated with work on queue management (mentioned above.)
Then, more recently we have used electronic signals emanating wirelessly from shoppers, with unique coding, to detect the presence of specific shoppers (identified by the electronic code, but with no personal identification associated,) to identify the exact time a shopper arrives in and leaves the store. The sampling rate of 5-15% of shoppers emanating signals from cell phones, or other BlueTooth devices, provides hundreds or thousands of very accurate measures of trip lengths (within accuracy of seconds.) (See Detecting Shopper Presence in a Shopping Environment Based on Shopper Emanated Wireless Signals.) These measures, when aggregated, produce the types of shopper trip length profiles mentioned above, and which we have been reporting in recent Views: Tell 'em Where to Go; Tell 'em Which to Buy!
What shopper behavior creates the "Trip Length Profile?"
Now we revisit the trip length profiles, with some fresh insight. We begin with noting that the most common trip length profile looks like this (examples of "typical" supermarkets from 2 continents):

The shoppers in these stores exhibit similar trip length profiles, with the majority of trips in the 5 to 10 minute range, and then with a steady fall off of trips, with each 5 minute cohort above 30 minutes having relatively few (and fewer) shoppers investing that much time in their shopping trip. (These are typical profiles for the most common general structure of supermarkets.)
Understanding this pattern of trip lengths (time,) and why it occurs, is fundamental to understanding how shoppers use their time in the store, and how store design and merchandising impact that time. Again, you can't manage that time if you don't measure it, and if you do measure it, you need to understand what is driving the measurement. To create that understanding we turn to the first of the two barriers to sales that we have identified:
- Where is? (navigation and search - choice of path and shelf location)
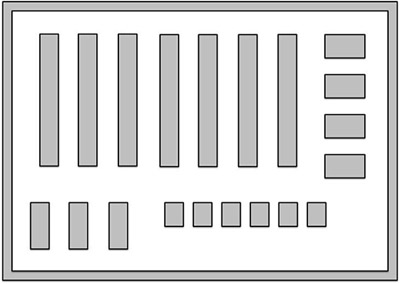
The stores cited above - and the majority of stores - are designed on a basic grid style layout, very reminiscent of their historical warehouse antecedents. By "grid" we mean a series of aisles, that when very long, often are intersected by transverse (cut-through) aisles, creating a "grid-like" pattern - similar to a warehouse:
Often, management creates a floor plan along such a grid pattern with at least two goals:
- To accommodate as large a suite of merchandise as possible - the store is a warehouse.
- To encourage shoppers to access as much of the floor as possible, during shopping trips.
The accommodation of a large suite of merchandise, other than capital and inventory costs, has two countervailing effects. First, the larger the selection, in general, the more attractive the store is to shoppers, conveying the message that with all these options, what I need is most likely here. As I often say, "I buy a few books a month, often from Amazon, because I figure that anyone with 50 million books, probably has the one I want."
Another effect that is not often noticed: shoppers and merchandise actually compete for floor space. The freedom of movement of the shoppers is restricted by the multiplication of displays; with a necessary multiplication of aisles to provide access to the displays. (This has been discussed under the heading, The Aisleness of Stores.) Further, the bigger the grid, the more navigational decisions shoppers need to make. That is, the grid itself is functionally a maze, which challenges shoppers' navigational skills. Another way to say this is, the more maze-like the store is, the less efficiently shoppers can shop it, and hence, more time is required for them to spend their money.
Virtually forcing shoppers to inconveniently spend their money more slowly (take more time,) guarantees that they will spend less money - lower sales per basket.
Wouldn't it be marvelous if we could actually measure the shopper's convenience (time) so that we could actually manage her convenience (time?)
Here we are considering half the convenience/measure/manage paradigm - navigation. In a Views several years ago we presented data on the role of time in relation to the number of items shoppers purchase, without understanding then how this related to convenience. See: "Average" Quicksand. Now we can better explain, and this has opened an important door to the measurement/management of navigational convenience. Consider this data on how long it takes shoppers to purchase various numbers of items.
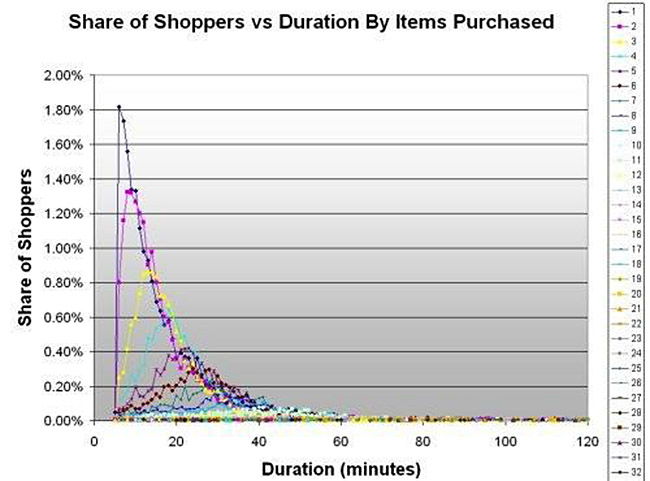
Long ago we noticed the steady evolution patterns here, beginning with single item purchases (1) on the left, with the highest peak, dark blue. Then for the two item purchases (2), the time required for those trips is a bit longer, shifting to the right on the graph, second highest peak, magenta. For shoppers buying five items (5), the distribution of time spent by those shoppers has further migrated to the right, purple. This is getting perhaps a little confusing, so consider only the 1, 5 and 12 item purchases:
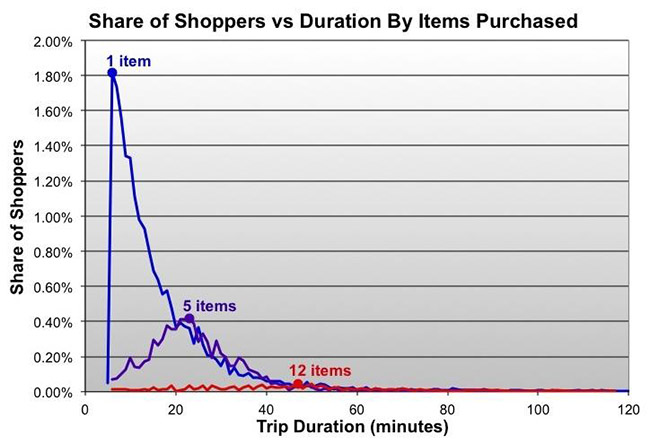
Both the 5 item and 12 item trips exhibit the relatively normal distribution - bell curve, while the curve of the 1 item purchase has more of a logarithmic shape. All of the curves taken together as a family exhibit mathematically a log-normal relationship. But the bottom line of this relationship, is that the single item purchase is distinctly different from the 5+ item purchases. That is, the shoppers behavior in the store on single item purchases is qualitatively different than on a five or twenty item trip. The single item trip is NOT just one fifth of a five item trip, or one twentieth of a twenty item trip. This is what we mean when we say it is qualitatively different. It has a different shopping character. One and two item purchases are "rabbits;" and four or more item trips are "turtles." This illustrates what we mean by the character of the trips. They are all "animals," but two distinctive types of animals.
The Short Trip "Character" Hypothesis
Let's walk through what is probably driving that difference - a hypothesis - by referring to our shopping grid. Remember, the grid essentially creates a maze when the shopper enters the store. But, if our shopper is only buying a single item, chances are that the shopper will not relate to the store as a maze, but instead will have a pretty good idea about where that single item probably is, and will hence move in a fairly direct manner to that item. From there, it is straight to the check-out, and everyone knows where that is. This means that a single item purchaser basically avoids dealing with the problem of the maze.
But now, think about the five item purchaser. The reality is that the shopper does not approach the store in a highly planned, rational basis. Instead, they instinctively and habitually match their trip strategy to a list with, perhaps, three items on it, even though they will end up picking up a couple more items in the process of buying those three. So they do NOT head straight for A, then B, and then C. Instead they begin a path that they expect will lead them to A, B and C, all at some point on a general path that they more or less instinctively conceive.
Moving to A does not lead to a trip to the checkout - the trip continues to B, with possibly another pickup on the way - distractions, distractions, distractions. In other words, where a single item purchase is highly focused, as more items are added, the navigational complications lead to diffusion. Diffusion leads to some shoppers being quite efficient, and others being horribly inefficient, with the mass being somewhere in between, the normal distribution - the bell curve.
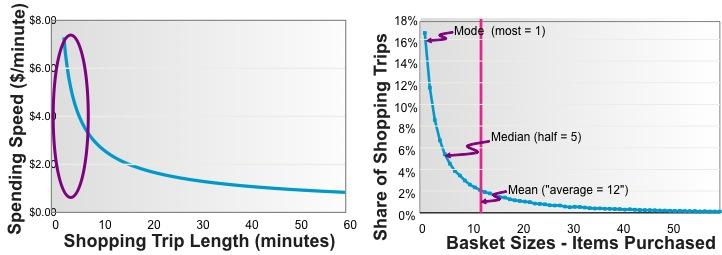
Essentially, the one or two item trip is convenient because it is efficient. And the shopper consequently spends money a lot faster, per item, on the small trip, than on the longer trip. As the following chart shows, the longer the trip, the slower the spending. This is a direct consequence of the fact that the maze increases inefficiency, the longer one is in it. Note also that about a third of all sales, by count, are of one or two items, and these constitute about 25% of total dollar sales of the supermarket.
We spoke to this convenience issue in the earlier Tell 'em Where to Go; Tell 'em Which to Buy! where we pointed out that having a dominant, intuitive, distinctive path, leads to great efficiency and outsize sales. We might never have noticed that Costco had such a path had we not measured the trip length profile, which showed us the kind of shared path congruence that Costco exhibits. This shows that measuring the trip length profile is not only useful for measuring the total convenience of the store (how many seconds it takes to sell a dollars worth of merchandise,) but also, potentially, the extent of trip congruence, one strategy for delivering the convenience of the single item trip, to individually, a series of multiple item purchases.
The challenge is to deliver single item convenience to the multiple item trip. That is, instead of a single item trip being qualitatively one fifth of a five item trip, let's make a five item trip qualitatively five times a single item trip. In other words, instead of one rabbit purchase, being one fifth of 5 turtle purchases, let's transform the 5 turtles in a 5 turtle purchase, into 5 rabbits!
By taking this approach, you may very well get ten purchases (rabbits) with the convenience (time) formerly associated with five items. Again, the key to massive sales increases, is massive convenience increases. I seriously doubt that this will be accomplished without measurement of the convenience (time.) Until retailers are more focused on the performance of the shoppers on the sales floor, than they are on the square feet of the sales floor, they will continue to share the mediocrity of their competition. The key to good management is good measurement. Non-measurement is the hallmark of mediocrity. Further, we would never have learned these principles without massive amounts of measurements.
Here's to GREAT "Shopping" for YOU!!!
Your friend, Herb Sorensen